Creating a dendrogram with R and ggraph
Nested and Hierarchical Data
When you have data with multiple subgroups, one option is to treat them as nested and/or hierarchical data.
In this technical note, I’ll outline how to create a dendrogram.
The data used is from the Extinct Plants data set from TidyTuesday.
Here’s the breakdown:
- Load Packages and Libraries
install.packages("ggraph")
install.packages("igraph")
library(ggraph)
library(igraph)
- Create a data frame with three levels
Taking the plants data frame, I do some wrangling to get the desired columns.
plants_data <- plants %>%
    select(group, binomial_name) %>%
    group_by(group) %>%
    arrange(group) %>%
    mutate(
        level1 = 'center',
        level2 = group,
        level3 = binomial_name
    ) %>%
    # important to ungroup here
    ungroup() %>%
    select(level1:level3)
- Create an edge list
# transform it to an edge list
plants_edges_level1_2 <- plants_data %>%
    select(level1, level2) %>%
    unique %>%
    rename(from=level1, to=level2)

plants_edges_level2_3 <- plants_data %>%
    select(level2, level3) %>%
    unique %>%
    rename(from=level2, to=level3)

plants_edge_list=rbind(plants_edges_level1_2, plants_edges_level2_3)
- Plot a basic chart
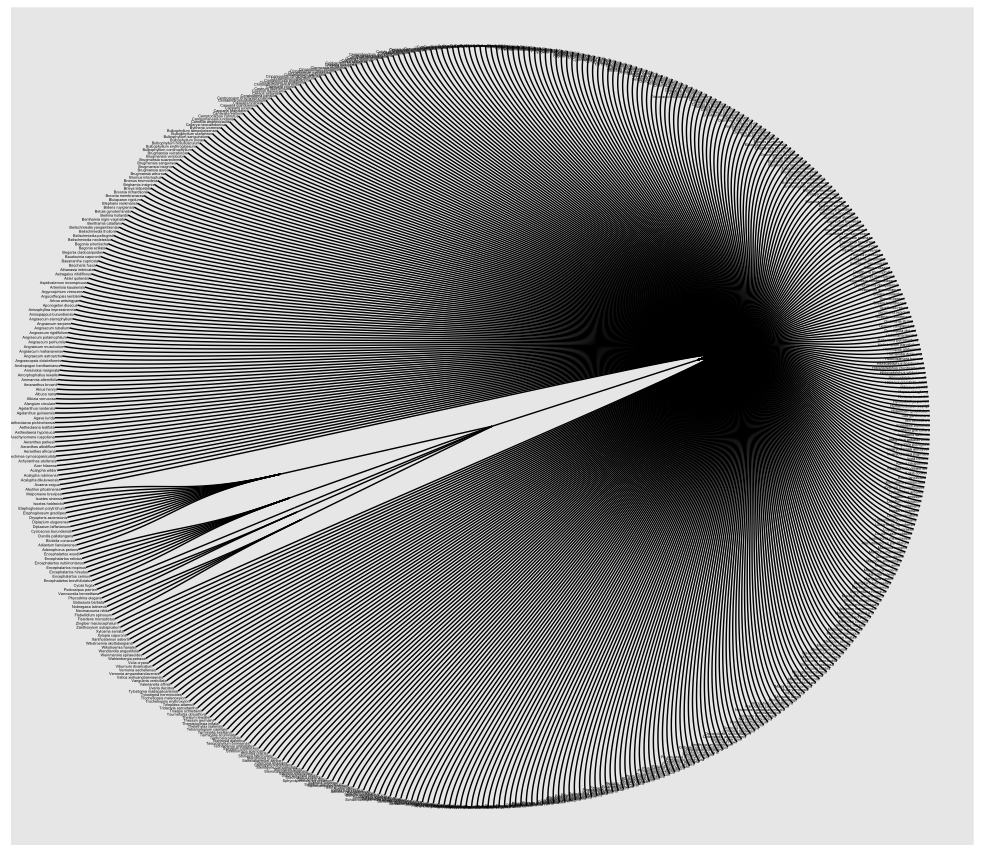
Because I have many observations, I’m optiing to use a “circular” dendrogram.
# plot plant dendogram
plantgraph <- graph_from_data_frame(plants_edge_list)

ggraph(plantgraph, layout = "dendrogram", circular = TRUE) +
    geom_edge_diagonal() +
    geom_node_point() +
    theme_void()
- Add text to the end of the edges
# add text & color(leaf)
ggraph(plantgraph, layout = "dendrogram", circular = TRUE) +
    geom_edge_diagonal() +
    geom_node_text(aes(label = name, filter=leaf), hjust = 1, size = 1) +
    geom_node_point()
NOTE: The breakdown of plant groupings are listed below. We can see the Flowering Plants disproportionately out number other groups like Ferns & Allies, Cycad, Mosses, Algae and Conifer.
When visualizing, we’re better off separating Flowering Plants from the other groups.
plants %>%
    group_by(group) %>%
    tally(sort = TRUE)

# A tibble: 6 x 2
  group                n
  <chr>            <int>
1 Flowering Plant    471
2 Ferns and Allies    13
3 Cycad                8
4 Mosses               4
5 Algae                3
6 Conifer              1
Here’s a sample picture of the plants


